MitigationMitigation measures for volcanic eruptions usually involve implementation of control structures to reduce the effects of flooding; land zoning and evacuation; and building reinforcement. We will discuss aspects of hazard mitigation in more detail in later lectures but you should think about the various choices of adjustment suited to mitigating volcanic hazards - modifying the event, modifying the loss, and modifying vulnerability. Important distinctions can be made between those choices available to people in developed countries and less developed countries - compare, for example, the choices made in the 1980 eruption of Mt St. Helens (USA) and the 1985 Nevado del Ruiz event (Colombia).
There are four main ways in which we can attempt to mitigate volcanic hazards: Volcanic-hazards studies have to be built on a strong foundation of research on volcanoes which includes geologic and geophysical mapping, petrologic and geochemical characterisation of eruptive products (e.g. tephra, lavas) and the dating of samples whose stratigraphy is established. An effective programme to mitigate volcanic hazards must include; identification of high-risk volcanoes; hazards assessment and zonation; volcano monitoring and eruption forecasting; and volcanic emergency management. (Tilling 1989) Data
needed for a hazards assessment must include; complete records of
historical eruptions; determination of pre-historic activity using
the geologic record to identify the nature of past events; stratigraphic,
petrologic, and geochemical data on the nature, distribution and
volume of eruptive products; and the dating of volcanic deposits.
By investigating the volcanic deposits surrounding a volcano one can interpret the type of volcanic process that formed each deposit. By mapping the deposit one effectively maps the distribution of the hazard responsible for the deposits origin. Then, by ordering and dating the deposits one can interpret the frequency of such hazards. Once
an eruption begins, information about past eruptions is crucial
for deciding how to react and make decisions about evacuation areas,
relocation of people, flood protection etc. Longer-term plans such
as water supplies and food production can also take past volcanic
activity into account. The foundation of these hazard maps and studies is that a particular volcano will behave in future as it has done in the past. For some volcanoes this approach is probably a good one, e.g. Mt Etna has produced many lava flows accompanied by small explosive eruptions over the past few centuries, an expectation of a similar eruption type in the future is reasonable. However, for volcanoes that have a wide variety of eruption types and magnitudes, it is more complex to anticipate future behaviour. For example, Mt. St Helens, like many other composite volcanoes (such as Ruapehu and Egmont volcanoes), has produced large explosive plinian and sub-plinian eruptions as well as small eruptions of domes, lava flows and small tephra eruptions. Several other limitations of this hazard assessment methodology exist and are discussed below. The further back in time that a geological investigation is extended, the less complete the preserved record will be, particularly where past periods of landscape instability (e.g. glaciations) may have removed or prevented preservation of the geologic sequence. Hence, apparent periods of quiescence or dormancy of a volcano (e.g. there is a 15,000-year dormant interval between the first two recognised eruptive periods of St Helens), may have contained eruptions, but their products were not preserved. The eruptive behaviour of a volcano may evolve or change over time, thus, making past behaviour a potentially poor indicator of future activity. Tarawera volcano in New Zealand for example, had a long history (up to at least 21,000 years ago) of large, rhyolitic, plinian tephra eruptions and dome extrusions. Its basaltic fissure eruption in 1886 was completely unprecedented. Extraordinary or catastrophic events, previously unrecorded or of very low incidence at a volcano may also occur, such as the 1980 debris avalanche and lateral blast of Mt St. Helens. As a volcano grows and changes shape and/or vent configuration, the areas at risk and types of volcanic activity may radically change. For example, the development of Crater Lake above the active vent of Ruapehu volcano perhaps 2000 years ago has greatly increased the occurrence of phreatomagmatic-style eruptions and production of lahars on the eastern volcano flanks. As a further Ruapehu example, topographic changes due to emplacement of glacial moraines has changed the catchments affected by lahars since the Last Glaciation. Lahars were once common in catchments northeast of the volcano, but now they are most likely in the southeastern catchments. Some of the limitations of using past behaviour as a guide can be overcome by including events that have occurred at other volcanoes, similar in structure and composition. Hence, events such as the large directed blasts that occurred at Bezymianny in 1956 and St. Helens in 1980, can be considered for hazard assessment of other similar andesitic-dacitic composite volcanoes. Also by gaining an appreciation of the more frequently observed types of behaviour at many different types of volcanoes one can better predict potential hazards. Some volcanic hazards assessments develop scenarios of likely types of future eruptions based on the geologic or historic records. Scenarios are normally chosen to re-enact past eruptions of differing magnitudes. The scenarios, which include details of likely precursory events and sequences of activity, provide useful exercises to prepare civil defence authorities for what to expect in a future eruption.
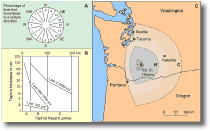
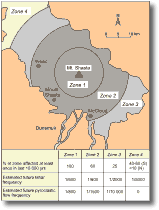
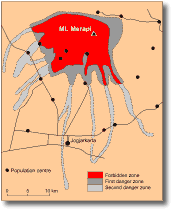
Volcanic hazard maps One of the most common and useful means of presenting information gained from detailed studies of the eruptive history of a volcano is a volcanic hazards map. These maps delimit zones related to each type of potential hazard and the relative degree of that hazard. Probabilities of future impacts can also be added to such maps if enough detailed information is available. These maps are useful for landuse planning, identification of critical population centres, communication lines or infrastructure with respect to hazard zones, and identification of places of refuge if an eruption were to occur. Hazard zonation for tephra falls For volcanoes that have produced numerous tephra falls in the recent geological past, detailed studies can lead to estimates of the probabilities of tephra accumulation. In addition, numerical models can aid in the prediction of the extent and thickness of potential tephra falls and may aid in delineation of hazard zones. Input into the models includes wind data, eruption rate and duration, column height, grain-size distribution and settling velocities of the tephra and other empirical coefficients. Uncertainties in the input variables limit the value of many of these models for hazard zonation, but they are very useful for understanding eruption dynamics and processes. Short term (e.g. day to day) forecasts of tephra hazards involve using current weather forecasts and normally a restricted range of eruption sizes based on the current activity of the volcano. Hazard zonation for lava flows Hazard maps for lava flows are based on the frequency with which areas have been covered by lava in the recent geologic past. They take into account other factors including, likely vent locations, typical lava flow lengths of the volcano and topography. For example, on Egmont volcano, geological evidence indicates that the most likely vent location for lava flows is either the summit or the parasitic cone on Fanthams peak. Past lava flows from this volcano have rarely travelled beyond 4 km of the vent and the longest is 5 km. Hence the hazard zone for occurrence of future lava flows from this volcano is a 5 km-radius circular region surrounding the main vents, except in the north where the Pouakai range forms a topographic barrier to lava flows and breaks the symmetry of the zone (see Map 1 in the "Volcanic hazards at Egmont volcano" booklet by Neall and Alloway, 1993). On large basaltic shield volcanoes (such as those in Hawaii) there is normally a much better record of lava flows in the recent geologic record compared to composite cones (like Egmont), where later flows tent to bury and obscure evidence of previous flows. Where a detailed lava flow record can be obtained, numerical probabilities of areas being inundated by lava flows can be calculated. Models of magma supply can also aid in long term lava flow forecasts at some volcanoes if they can be constrained by geologic, petrologic, age and geophysical data. Hazard zonation for pyroclastic flows and surges Zones for these events vary considerably between volcanoes because of the wide range in magnitude of these events. Workers on very active volcanoes define zones on the basis of the extent of pyroclastic flows and surges of historic age (e.g. on Merapi in Indonesia, and on Mayon in the Philippines). Others use a longer time interval, e.g. at St Helens where the extent of these events in the last 4500 years is used. Some workers define several hazard zones on the basis of possible shifts in vent location or model past pyroclastic flows of differing magnitudes. Hazard zonation for laterally directed blasts
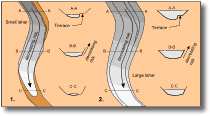
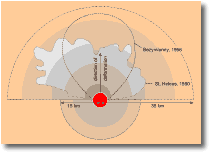
The large laterally directed blasts of Bezmianny in 1956 and St. Helens in 1980 were caused by unloading of magmatic and hydrothermal systems during a flank collapse of the volcano. These blasts affected large areas and extended up to 25-35 km from the volcano, hence hazard zones for such events can be circles of around 35 km radius, centred on the volcano (Fig. 17). Precursory activity or structural changes prior to an eruption may indicate the sector most prone to collapse and subject to lateral blast, enabling the hazard zone to be restricted to these areas. Topographic features of the volcano may also cause certain volcano sectors to be more prone to directed blasts than others and the hazard zone can be altered accordingly. For smaller laterally directed blasts from growing domes, ballistic impacts and pyroclastic flow deposits are mostly contained within 10 km of the dome. For hazard zonation a circle of 10 km radius (or perhaps 15 km, with a 5 km additional margin of safety), surrounding the dome could be used. Unusual dome shapes or the dome position with respect to topographic barriers may be used to modify the shape of the hazard zone to cover the most likely blast orientations. Hazard zonation for debris avalanches and lahars Lahar hazard zones normally have sharply defined upper limits within 10 m of valley floors, because lahars are much more strongly topographically controlled than other flowage events such as pyroclastic flows. Inundation levels of past lahars are used to determine hazard boundaries along valley sides. Limitations of this method may be due to changes in the valley floor configuration since past lahars as well as there being wide potential differences in the origins and characteristics (and hence inundation levels) of lahars. Evidence from historic floods can be used to partially counter these limitations. Mathematical models of lahar flows are also being developed and may lead to future alternative methods of defining lahar hazard zones. They are currently severely limited by an incomplete understanding of the physical processes within lahars and uncertainty of model parameters. Many maps group the debris avalanche hazard zones with those of lahars. However, large debris avalanches are potentially less controlled by topography than lahars and can overtop drainage divides. Evaluating the height-to-length ratios of debris avalanches can be used to better predict hazard zones for these events. The relationship of debris avalanche length (L) = H/f is used, where H is the altitude difference between the volcano summit and a valley floor at 20 km distance. The coefficient f, is chosen for differing levels of conservatism in the estimates, e.g. the values of 0.05, 0.075 and 0.09 could be used to define three hazard zones of differing probabilities of being affected by debris avalanches. Hazard zonation for volcanic gases Volcanic gases (and hence their hazard zones) are normally restricted close to the vent and in low lying areas. In proximal areas these zones coincide with flowage hazards and thick tephra, while in distal areas they are associated with thinner and finer tephra falls. On some specific volcanoes or fumarole fields, gas hazard zones need to be produced independently rather than being included with other hazards, e.g. Lake Nyos and Lake Monoun in Cameroon, where around 1800 people were killed by release of CO2 in 1984-1986. Hazard zonation for volcanogenic tsunamis These can be based on the evidence of inundation from past tsunamis, but this is made difficult by the scant geological evidence left from these events. The zone limits need to take into account the source and mechanism of tsunami wave generation, wave magnitude and their amplification by coastal geography. Advance numerical models are used to estimate tsunami wave heights and travel times which can be used in hazards zonation. The greatest uncertainty remaining is how will the tsunami be generated and how large it will initially be. Regional hazard maps and site-specific hazards maps Regional hazard maps show the combined hazards from several volcanoes in a region and are useful for landuse planning and emergency response by civil authorities. These indicate areas which may lie in hazard zones from several different volcanoes. Many assessments of hazards are made at specific sites during the planning of construction of dams, factories etc. These mostly remain unpublished. Site-specific maps are prepared in the same way as hazard maps with wider scope but take into the account the activities of the site and ways in which primary and secondary volcanic events will affect these. Mitigation measures are also examined and proposed and their effectiveness gauged.
|
||||||
|
||||||
|
||||||