Mt Pinatubo
1991 Eruption
Ash fall impacts
Figure
22.
 Heavy
ash falls of >10 cm occurred over 100 km from the volcano in the
period June 12-15. Ash fall was directed to the west and south-west
(Fig. 22), and fell over the South China Sea, reaching as
far as Vietnam, Cambodia and Singapore. A total area of around 840
by 400 km was affected by ash fall. Heavy ash fall resulted in complete
darkness in some areas, buried crops and agricultural land, clogged
water supply and sewerage systems, and caused many building and
house roof collapses. The largest of the several tephra eruptions
occurred on June 15 and comprised 3.4-4.4 km3 of tephra, covering
around 2000 km2 with 10-25 cm of rain-saturated tephra. Heavy
ash falls of >10 cm occurred over 100 km from the volcano in the
period June 12-15. Ash fall was directed to the west and south-west
(Fig. 22), and fell over the South China Sea, reaching as
far as Vietnam, Cambodia and Singapore. A total area of around 840
by 400 km was affected by ash fall. Heavy ash fall resulted in complete
darkness in some areas, buried crops and agricultural land, clogged
water supply and sewerage systems, and caused many building and
house roof collapses. The largest of the several tephra eruptions
occurred on June 15 and comprised 3.4-4.4 km3 of tephra, covering
around 2000 km2 with 10-25 cm of rain-saturated tephra.
Due
to the heavy, wet tephra fall (it fell during Typhoon Diding), 189
people were killed by collapsing buildings.
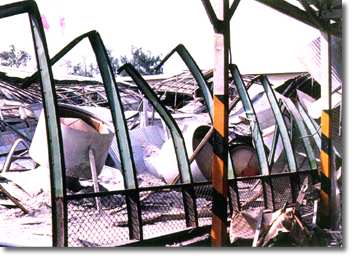
Plate 9. Residential buildings that withstood 20 cm of pumiceous
tephra at the Clark Air Base, from the eruptions of Mt. Pinatubo,
the Philippines in June, 1991. - V. E. Neall.
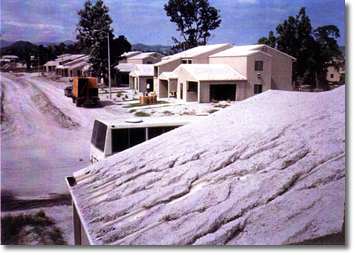
Plate 10. Collapsed vegetable market building at the Clark
Air Base, where the weight of wet tephra caused roof collapse and
bent vertical steel I-beams. Note jumbled circular ventilators that
were previously installed in the roof. - V. E. Neall.
Figure
23.
 The
tephra eruptions had world-wide effects in addition to those on
Luzon. The eruption columns on June 12-15 penetrated the tropopause,
blasting millions of tonnes of gases and fine particles into the
stratosphere. Within the stratosphere there is very little water
vapour and very high winds dispersed the cloud of material rapidly
around the world (Fig. 23). The
tephra eruptions had world-wide effects in addition to those on
Luzon. The eruption columns on June 12-15 penetrated the tropopause,
blasting millions of tonnes of gases and fine particles into the
stratosphere. Within the stratosphere there is very little water
vapour and very high winds dispersed the cloud of material rapidly
around the world (Fig. 23).
As
the cloud travelled around the globe it spread, widening to the
north and south, completely encircling the globe within 22 days.
The clouds resulted in vivid sunsets in many parts of the world
and a daytime haze above others. Satellite observations were hindered
by the cloud and cooler and abnormal weather patterns were partly
attributed to its presence blocking out sunlight. The SO2
gases within the cloud also caused some corrosion of the acrylic
windows on aircraft.
Pyroclastic flows
Figure
24.
 The
first pyroclastic flows travelled only 4-5 km from source but later,
one on June 12-16 travelled up to 16 km from source at around 80
km/hr. These incandescent flows affected the Marella, Maraunot,
O'Donnell and Sacobia river valleys (Fig. 24). Around 5.5 km3 of
pumiceous pyroclastic flow deposits were emplaced by the largest
eruption on June 15. These affected an area of around 400 km2, drastically
altering the landscape by infilling former river valleys with huge
thicknesses of deposits (up to 100 m). The
first pyroclastic flows travelled only 4-5 km from source but later,
one on June 12-16 travelled up to 16 km from source at around 80
km/hr. These incandescent flows affected the Marella, Maraunot,
O'Donnell and Sacobia river valleys (Fig. 24). Around 5.5 km3 of
pumiceous pyroclastic flow deposits were emplaced by the largest
eruption on June 15. These affected an area of around 400 km2, drastically
altering the landscape by infilling former river valleys with huge
thicknesses of deposits (up to 100 m).
Up
to 2 years after the eruption, collapse of the still hot (>300 oC),
thick pyroclastic flow deposits caused secondary pyroclastic flows
that travelled up to 10 km. In addition, during heavy monsoon and
typhoon rains in the rainy seasons following the eruption, over
200 hot lahars (c. 50oC) were generated by erosion of
the 1991 pyroclastic flow deposits, and more in the two years following.
Rainfall runoff interacting with the hot pyroclastic flow deposits
caused many secondary phreatic explosions with associated minor
ash falls.
Lahars
Figure
25.
 Lahars
produced during the Pinatubo eruption and in the following years
caused the greatest damage and longest-term effects on the surrounding
population and landscape. During the eruption, typhoon rains and
eruption-related storm cells generated lahars on both the eastern
and western volcano flanks. However, the most widespread lahars
were generated by monsoon and typhoon rains, after the emplacement
of the unconsolidated pyroclastic flow and tephra deposits. Eight
major catchments were affected by lahars (Fig. 25). With continuous
lahars occurring, channels were filled to their capacity with sediment,
causing later lahars to overflow and inundate lowlands surrounding
the river channels. Lahars
produced during the Pinatubo eruption and in the following years
caused the greatest damage and longest-term effects on the surrounding
population and landscape. During the eruption, typhoon rains and
eruption-related storm cells generated lahars on both the eastern
and western volcano flanks. However, the most widespread lahars
were generated by monsoon and typhoon rains, after the emplacement
of the unconsolidated pyroclastic flow and tephra deposits. Eight
major catchments were affected by lahars (Fig. 25). With continuous
lahars occurring, channels were filled to their capacity with sediment,
causing later lahars to overflow and inundate lowlands surrounding
the river channels.
Since
1991, lahars have occurred in the wet seasons of 1992-1994 and the
total area affected has progressively expanded, although the frequency
of lahars has declined. At the end of the 1994 rainy season, around
2.2 km3 of the 1991 pyroclastic flow deposits and tephra had been
eroded and deposited on alluvial fans surrounding the volcano. The
1991-1994 lahars were mostly hot (around 50oC) and steaming. The
lahars ranged from dilute, erosive hyperconcentrated streamflows
to highly concentrated, viscous debris flows, containing dominantly
pumiceous sand. Lahars in 1995 were predominantly cold and contained
greater proportions of pre-1991 deposits within them.
Lahar and some secondary pyroclastic flows caused the blockage of
several catchment tributaries to form temporary lakes, the largest
of these being on the SW flank of Pinatubo. Many floods and cold
hyperconcentrated streamflows were caused by breaching of these
lakes, three such events along the Passig-Potrero River caused the
loss of several lives. Prediction
and early warning of these lake-breakout
floods and lahars proved difficult because they were not dependant
on heavy rainfall and were in areas difficult to monitor due to
residual heat and hydrothermal explosions (in the area of pyroclastic
flow deposits).
Lahar monitoring and warning system
Figure
26
 Most lahars generated on Pinatubo are a result of heavy rainfall
on surfaces of unconsolidated pyroclastic flow deposits. The main
feature of these surfaces is that they have a very low permeability
to rainfall - causing large amounts of runoff. Hence, to identify
conditions likely to initiate lahars, telemeted rain gauges were
installed in several catchments around the volcano (Fig. 26).
Lahars in 1991 and 1992 were initiated following rainfalls of 0.3-0.4
mm per minute, sustained for over 30 minutes. When rain gauges now
detect this intensity of rainfall within a particular catchment,
lahar watches are set up. Lahar watchers are assigned to designated
sites (Fig. 26) and comprise army, police or civil defence
personnel. In addition to this network, trip wires and acoustic
flow monitors are installed at various sites (Fig. 26). Acoustic
flow monitors detect ground shaking near lahar channels caused by
the passage of debris flows and hyperconcentrated streamflows.
Most lahars generated on Pinatubo are a result of heavy rainfall
on surfaces of unconsolidated pyroclastic flow deposits. The main
feature of these surfaces is that they have a very low permeability
to rainfall - causing large amounts of runoff. Hence, to identify
conditions likely to initiate lahars, telemeted rain gauges were
installed in several catchments around the volcano (Fig. 26).
Lahars in 1991 and 1992 were initiated following rainfalls of 0.3-0.4
mm per minute, sustained for over 30 minutes. When rain gauges now
detect this intensity of rainfall within a particular catchment,
lahar watches are set up. Lahar watchers are assigned to designated
sites (Fig. 26) and comprise army, police or civil defence
personnel. In addition to this network, trip wires and acoustic
flow monitors are installed at various sites (Fig. 26). Acoustic
flow monitors detect ground shaking near lahar channels caused by
the passage of debris flows and hyperconcentrated streamflows.
A series
of lahar warning signals are used by civil defence authorities to
convey information to the public on the likelihood of lahars, based
on data from the detection network (Table 10). At the initial stages
of setting up the lahar warning network, some lahars were missed
by malfunctioning acoustic flow monitors; however since then every
passing lahar has been detected by the equipment.
Although the lahar warning system proved to be a success overall,
some problems were experienced. Several early false alarms led people
to doubt all alerts, delaying some evacuations. In other areas,
lahar dikes and sediment control structures that were built led
to a false sense of security and also delayed evacuations.
Other lahar hazard mitigation strategies
Lahars
from Pinatubo were expected for several years because of the huge
thickness and volume of pyroclastic flow deposits on the flanks
of the volcano. To help authorities to manage these, short term
(for one-two years) lahar hazard maps were prepared. Initially these
used topography and channel morphology to delineate hazard zones,
but the maps were continually updated as lahar sedimentation changed
channel forms and dynamics, causing the potential for lahars to
inundate different areas.
Table
10. Lahar warning signals used by PHIVOLCS and the civil defence
authorities around Pinatubo, adapted from PHIVOLCS (1991).
| Warning
number |
Meaning |
1
READY |
Rain is
falling at Pinatubo volcano and vicinity. No need to evacuate
at this stage.
People residing near river channels and low-lying areas at the
foot-slopes of the volcano area advised to pack their belongings
and be ready for any eventualities. They should tune into their
local radio stations for further announcements. At night, it
is important that at least one family member should stay awake
to monitor warning signals. |
2
GET SET |
Rain continues
for at least 30 minutes and rainfall intensity and duration
are approaching critical level or threshold value. People will
be informed whether or not the rainfall can trigger a lahar.
|
3
GO |
Monitoring
instruments and/or people manning watch points detect lahar(s).
Affected residents should transfer to pre-determined high ground
in their area. |
Figure
27
 For
long term planning a yearly sediment budget was prepared to determine
the expected duration and magnitude of lahars in the years following
the eruption. This was prepared using an exponential decay model
and was continually refined with the addition of information available
in successive years (Table 11, 12 and Fig. 27). For
long term planning a yearly sediment budget was prepared to determine
the expected duration and magnitude of lahars in the years following
the eruption. This was prepared using an exponential decay model
and was continually refined with the addition of information available
in successive years (Table 11, 12 and Fig. 27).
In
cases of prolonged intense rainfalls associated with typhoons or
siyam-siyam (continuous monsoonal rains for more than 9 days), expected
sediment yield could be significantly altered. In addition, events
such as secondary pyroclastic flows, stream piracy, and lake breakouts
greatly affected sediment delivery to the lowlands.
Armoured
(by boulders etc.) and unarmoured sand dikes were constructed to
protect some communities directly threatened by lahars. However,
dikes and sediment retention structures in the rivers draining Pinatubo
mostly proved ineffective in containing the huge volumes of eroded
sediment. River channels quickly aggraded with sediment from lahars
and floods, overtopping almost all of the dikes built. If dikes
were effective in one area, greater sediment loads travelled farther
downstream, inundating other areas.
It
has been estimated that to trap the Pinatubo sediment in retention
basins 10 m deep, 120-360 km2 of land would be required. Or alternatively
if smaller basins were constantly being excavated, a huge number
of trucks and diggers would be required to keep pace with the sediment
inputs. Either of these options was very expensive.
Channelisation
of lahars, by dikes and levees, although experimented with, is not
an effective solution at Pinatubo. The gradient of channels on the
lowlands is too low to provide enough energy to move sediment all
the way out to sea. No matter how efficient the channels were constructed,
they remained filled with sediment.
Table
11. Estimated volumes of sediment to be transported to lowlands
surrounding Mt. Pinatubo, adapted from Pierson et al., (1992).
|
Catchment
|
Source
volume (km3)
|
Erosion
intensity factor*
|
New
deposits eroded (km3)
|
Old
deposits eroded (km3)
|
Estimated
volume transported to lowlands (km3)
|
|
Low-source
volume estimates
|
|
Tarlac
|
0.3
|
0.4
|
0.12
|
0.01
|
0.13
|
|
Bambam
|
0.6
|
0.4
|
0.24
|
0.02
|
0.26
|
|
Abacan
|
0.1
|
0.4
|
0.04
|
0.004
|
0.04
|
|
Pasig-Potrero
|
0.3
|
0.4
|
0.12
|
0.01
|
0.13
|
|
Porac/Gumain
|
0.03
|
0.7
|
0.02
|
0.002
|
0.02
|
|
Santo
Thomas
|
1.0
|
0.5
|
0.5
|
0.05
|
0.55
|
|
Bucao
|
2.5
|
0.5
|
1.25
|
0.13
|
1.38
|
|
Total
|
4.8
|
|
2.29
|
0.23
|
2.51
|
| |
|
High-source
volume estimates
|
|
Tarlac
|
1.0
|
0.4
|
0.40
|
0.04
|
0.44
|
|
Bambam
|
0.9
|
0.4
|
0.36
|
0.04
|
0.40
|
|
Abacan
|
0.2
|
0.4
|
0.08
|
0.01
|
0.09
|
|
Pasig-Potrero
|
0.5
|
0.4
|
0.20
|
0.02
|
0.22
|
|
Porac/Gumain
|
0.05
|
0.7
|
0.04
|
0.004
|
0.04
|
|
Santo
Thomas
|
1.3
|
0.5
|
0.65
|
0.07
|
0.72
|
|
Bucao
|
3.1
|
0.5
|
1.55
|
0.16
|
1.71
|
|
Total
|
7.1
|
|
3.28
|
0.34
|
3.62
|
Table
12.
Annual sediment delivery from Mt. Pinatubo, estimated by exponential
decay models with actual data from 1991-1994, adapted from PHIVOLCS
(1995).
|
Year
|
Actual
(
x 106 m3)
|
Best
fit
(
x 106 m3)
|
Low
(
x 106 m3)
|
High
(
x 106 m3)
|
|
1991
|
805
|
801
|
725
|
925
|
|
1992
|
555
|
596
|
539
|
688
|
|
1993
|
505
|
444
|
401
|
512
|
|
1994
|
310
|
330
|
299
|
381
|
|
1995
|
|
246
|
222
|
283
|
|
1996
|
|
183
|
165
|
211
|
|
1997
|
|
136
|
123
|
157
|
|
1998
|
|
101
|
91
|
117
|
|
1999
|
|
75
|
68
|
87
|
|
2000
|
|
56
|
51
|
65
|
|
2001
|
|
42
|
38
|
48
|
|
2002
|
|
31
|
28
|
36
|
|
2003
|
|
23
|
21
|
27
|
|
2004
|
|
17
|
16
|
20
|
|
2005
|
|
13
|
12
|
15
|
|
2006
|
|
9
|
9
|
11
|
|
2007
|
|
7
|
6
|
8
|
|