
| ||||||||||||||||||||||||||
Wildfire Mitigation: Prevention and Protective MeasuresWildfire mitigation includes any activities that prevent an emergency, reduce the chance of an emergency happening, or lessen the damaging effects of unavoidable emergencies. The wildland-urban interfaceModern understanding indicates that wildland fire is an intrinsic ecological process in nearly all ecosystems. Current population growth worldwide and the expanding development into traditionally non-urban areas have increasingly brought humans into contact with wildfires, with the threat to private property from wildfire increasing. Generally, these homes, occupy the wildland/urban interface (WUI), and are located in areas “where structures and other human development meet or intermingle with undeveloped wildland or vegetative fuels” (Federal Wildland Fire Policy, 2001). These are areas where wildland vegetation and urban encroachment co-exist, but neither dominates. There are many different types of WUI areas, and can include:
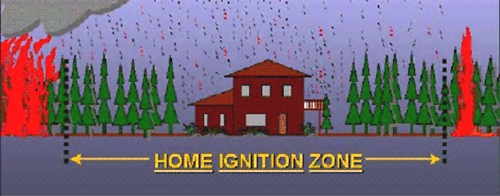
The rising number and frequency of wildfire incidents in these areas, increasing fuel loads resulting from fire-exclusion policies, and the growing number of people relocating from cities to rural and forested areas have created the potential for major interface fires to occur. As mentioned, wildland-urban fire occurs when a fire burning in wildland vegetation fuels gets close enough with its flames or firebrands (lofted burning embers) to potentially create ignitions of the residential fuels. Understanding how homes ignite provides the basis for appropriately assessing the potential for home ignition and thereby effectively mitigating wildland-urban fire ignitions. All fires spread by meeting the requirements for combustion (see section 2) – that is, a sufficiency of heat, fuel, and oxygen. In the context of severe wildland-urban fires, oxygen is not a limiting factor so this type of fire spreads according to its sufficiency of fuel and heat. Homes and immediate surrounding vegetation are the fuel, and the heat comes from the flames and/or firebrands of the surrounding fires. Research of Cohen (1995, 2000), and Cohen and Butler (1998) indicate that the potential for home ignitions during wildfires principally depends on a home’s fuel characteristics and the heat sources within 30 to 60 m (100 to 200 feet) adjacent to the home (Fig. 16). This relatively limited area has been termed the home ignition zone.
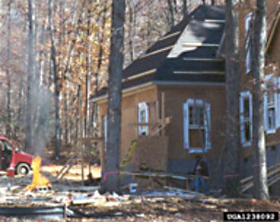
Wildland fire will always occur in forest and grassland environments and will thus have an impact on people, property, and resources. Recognising this inevitability of fire occurrence coupled with how homes ignite during wildland fires suggests a management approach that focuses on preventing home ignitions. That is, we work to reduce a community’s vulnerability to fire rather than attempting to eliminate wildland fire encroachment. The focus is principally on preparing the home for the wildfire by reducing the potential for home ignition within the home ignition zone. Major changes to the home and its immediate surroundings such as replacing a flammable roof and removal of vegetation such as forest thinning, seasonal removal of firewood piles, dead leaves, conifer needles etc. from around and next to the home should occur before severe fire conditions (Fig. 17).
Within high-risk areas, detailed landscaping is necessary, including:
Before wildfire threatens, much care should be taken to design and landscape your home with wildfire safety in mind. Construction materials and plants should be selected that can help contain fire, rather than fuel it. Construction with fire resistant or non-combustible materials on the roof and exterior structure of the dwelling is paramount; otherwise, it is possible to treat wood or combustible material used in roofs, decking or housing with approved fire retardant chemicals. It is important that entire neighbourhoods work together to ensure fuel management practices are carried out, and the risk of wildfire understood, so that disaster can be averted by preparing in advance and working as a community. Public education Individual and community preparedness, including plans for the early detection and suppression of wildfires, is a vital element in disaster reduction. Public education plays an important role in both hazard prevention, as well as keeping the public informed on wildfire weather, forecasting, and up-to-date with the current fire fighting methods and hazard prediction tools, such as satellite systems. One of the most effective forms of public education is that carried out in the school system. Depending on the location of the school and the existing hazard, students can be educated as to the importance of fire prevention through education materials such as hand-outs, wildfire safety videos, visits from firefighters, and props. These children can then converse with family members and the wider community, and by doing so the safety message can flow from person to person. Another way to get the fire prevention message out is to have fire station tours. Groups from the community, such as Girl Guides, Boy Scouts, or school classes, should be encouraged to visit the fire station. During their visit they can be shown around the station, learn about the equipment, be part of demonstrations, and ask various questions. Television and radio can also be used effectively to get the fire safety message across. A “Fire Prevention Week” is also a good time to get the media involved. Roadside signs and billboards may be an effective way of reaching the general public. As people continue to move away from the suburban sprawl into scenic wildland/urban interface areas, residents can misjudge the potential for wildfire, and may consequently fail to take the proper precautions. “Although the majority would understand the risk, they do nothing to prevent the problem or help themselves. They believe the odds are favourable that the fire will not start in their own backyard, or if it does, somebody will put it out, or they will have plenty of time to escape. These assumptions are human nature. They are not denying the actual possibility of fire, they are just reacting to life’s demands in their own priority order, and unfortunately, fire is not high enough a priority to get a reaction” (Gamble, 1993). Such gullibility may have disastrous results. Public awareness programmes aimed at all wildland/urban interface dwellers may prove vital in mitigating the potential effects of a wildfire event. Even with ignition resistant homes, protection effectiveness relies on an understanding of how homes ignite during wildland fires along with recognising operational and logistical fire suppression limitations. These differences suggest the need for wildland-urban fire specialists to work with homeowners, particularly in high-risk zones, both before and during a wildfire. Before the wildfire the wildland-urban fire specialist should use his/hers expertise to identify vulnerable residential areas and facilitate community efforts to reduce home ignitibility. During wildfires, specialists can work with homeowners and fire protection teams to identify and implement effective actions for reducing home destruction.
Fire suppressionSince the beginning of time natural wildfires (lightning ignited) have been an important environmental factor in the ecology of vegetation communities. As a result, natural ecosystems have adapted to particular fire regimes. However , with the earliest settlers came the realisation that fires are a threat to life, our natural resources and property. And as a consequence, for most of the 20th century wildland fires were prevented or suppressed whenever possible. However, after years of successful fire suppression and prevention practices, land managers noticed that the health of many forests and grasslands had deteriorated. Years of suppression had led to a shift in the composition of the vegetation that is found in the wildlands, and a loss of important biodiversity. Dead trees, branches, and other highly flammable materials were left to accumulate; ironically, the fire suppression practices intended to protect us from the destruction of fire actually increased the hazard. Effects to ecosystems Ecosystems respond differently to fire suppression. Moist and cool ecosystems, such as subalpine environments, burn too infrequently (with fire intervals longer than 75 to 100 years) to be affected by fire suppression. Similarly, ecosystems that are extremely dry, such as desert or cold alpine environments, are so unproductive that they accumulate fuel too slowly to have been affected by the fire suppression practises of the past. Temperature ecosystems, on the other hand, tend to promote frequent, low intensity wildfires, and have proven to be more adversely affected by fire suppression (Agee, 1993). In these temperate, productive ecosystems, average fire size and severity have increased dramatically. Decades of fire suppression had left a legacy of increased fuel loads and ecosystems choked with an understory of shade-tolerant, late successional plant species. These now structurally homogenous ecosystems are conducive to the large, severe fires, especially during the hot, dry, windy periods of late summer and autumn. Such ecosystems also have fewer structural breaks to retard fire spread and intensity. Plant and animal mortality in these ecosystems is relatively high following the large stand-replacing fires that are now much more likely to occur in these ecosystems. The greatest effect of fire suppression on biological diversity is not on the diversity within a particular habitat, but on the diversity of habitats across a landscape (Whittaker, 1977). Fire suppression increases uniformity in habitats as competition eliminates early successional species.
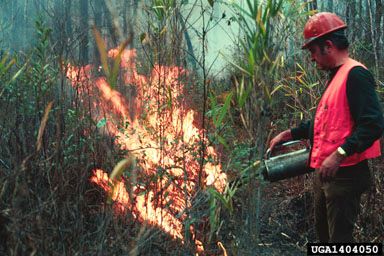
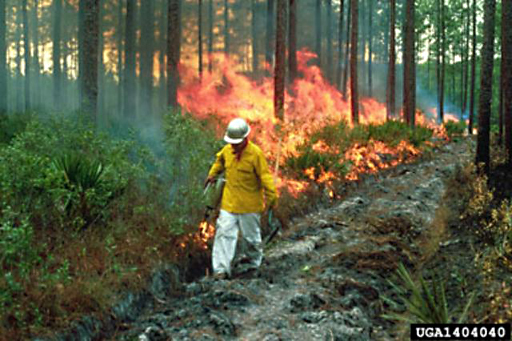
Prescribed firesLong term fire suppression or bans can increase the risk of a major wildfire event due to the build up of flammable fuel over time. The recognition of this relationship has led to the increasing use of low-intensity, controlled fires, or prescribed fires (Fig. 18) to reduce surface fuel, particularly at the rural-urban fringe. The prescribed burn needs to be undertaken during a time of the year when wind, fuel moisture, and humidity reach the desired range, called a prescription window, a term referring to the range of acceptable conditions that will allow the fire to accomplish its goal (Fuller, 1991). Preparing for a prescribed burn In preparing for a planned ignition, fire managers must consider two things that can affect fire behaviour: wind, and topography. Local wind conditions must be considered to ensure they are suitable to both carry the fire along, and carry the smoke away. Fire managers must also consider possible damage to structures, rare plants, and archaeological remains; as well as ensuring that the public are informed to prevent misunderstandings.
On the other hand, prescribed burning is labour-intensive, can lead to uncontrolled fires, with emissions having the potential to cause air pollution (see section 4.3). The effect of smoke on humans limits the use and frequency of controlled fuels. As previously mentioned, incomplete combustion is favoured when fuels burn without suitable oxygen, resulting in thick black smoke with high particulate levels. These emissions are undesirable and prescription managers must conduct the fire in such a way to avoid smoke production. This can be done in several ways. Fires burnt against the wind produced much less smoke. Furthermore, because a fire will move more slowly into the wind, the fuel will burn much hotter, and less smoke is produced as a result. Waiting for fuel to completely dry out also reduces smoke (Fuller, 1991).
Hazard predictionWildfire forecasting Before satellite imagery and powerful computer hardware and software were available, wildfires were traditionally mapped with labour intensive manual methods, or not at all. Nowadays, fire forecasting models in the United States, Australia, and New Zealand, are based on a comprehensive assessment system, which consists of fire danger maps, weather observations, dead fuel moisture maps, live fuel moisture maps/greenness mapping, drought maps, and atmospheric stability maps. Each component is briefly summarised below: Fire Danger Maps - A fire danger rating map is developed using current and historical weather and fuel data. These data are transferred to models to give present condition information. Maps are developed to give a visual presentation of the potential danger of fire in a particular region. Fire Weather Observations and Next Day Forecasts - Observation maps are developed from the fire weather network. The latest observations include 10 minute average wind, 24 hour rain total, temperature, relative humidity, and dew point information. Next day forecasts are also displayed. Dead Fuel Moisture - Fire potential is heavily dependent on dead fuel moisture. There are three classes of dead fuel moisture - 10-hour, 100-hour, 1000-hour. When you have a drying of 1000-hour fuels, you have major potential for fire problems. Live Fuel Moisture/Greenness Maps - Live fuels also play a major part in the potential of fire. Vegetative "Greenness" determines fire spread. The greener the vegetation, the lower the fire potential (see section 5.4.4) Drought Map – Drought maps depict soil and duff moisture. The Keetch-Byram Drought Index measures a soil’s capacity to absorb water. Atmospheric Stability Maps - Atmospheric stability is measured by the Haines Index. This index is derived by adding two terms together, the stability term, and the moisture term (Table 3). The stability term is derived from the temperature difference at two atmosphere levels. The moisture term is derived from the dew point depression at a single atmosphere level. Table 3. Atmospheric stability term and moisture terms – used in wildfire forecasting.
For the technically minded, the index reflects the temperature difference between heights where the air pressure is 850 and 700 hectopascals; and also the dew point depression at the 850 hectopascal height. Each of these are scored from 1 to 3 and the two are added together (thus the range of 2 to 6 for the Haines Index).
This index can be used to predict the potential for large plume-driven fire growth.
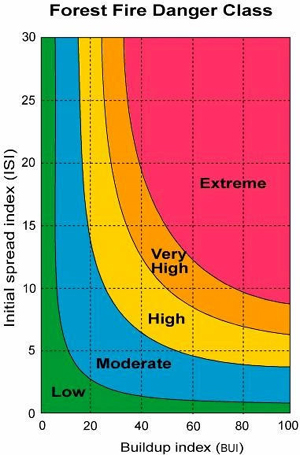
New Zealand National Fire Danger Rating SystemThis information has been adapted from the New Zealand Rural Fire Authority website: http://www.nrfa.org.nz/. It is highly recommended that you visit this website. For additional reading related to fire management in New Zealand see reading (3) at the end of this section. Fire Weather Index (FWI) A guide to understanding and interpreting the Fire Weather Index information Fire Danger Rating A fire danger rating system should supply an objective answer to the question: 'What is the probability of a fire starting, spreading, and doing damage today?' It enables fire managers to properly assess the levels of preparedness and the suppression resources needed to keep fire losses to a minimum. A fire danger rating system measures the variable elements which cause day to day changes in fire risk, and interprets the information gained. The information is used to:
The six standard components of the FWI System provide numerical ratings of relative wildland fire potential. The first three components are fuel moisture codes that follow daily changes in the moisture contents of three classes of forest fuel with different drying rates. For each, there are two phases - one for wetting by rain and one for drying - arranged so that the higher values represent lower moisture contents and hence greater flammability. The final three components are fire behaviour indexes, representing rate of spread, amount of available fuel, and fire intensity; their values increase as fire weather severity worsens. The system is dependent on weather only and does not consider differences in risk, fuel, or topography. It provides a uniform method of rating fire danger throughout New Zealand. The six components are described below. Fine Fuel Moisture Code (FFMC) Duff Moisture Code (DMC) Drought Code (DC) Initial Spread Index (ISI) Buildup Index (BUI) Fire Weather Index (FWI) These components are then combined to give a rating of the fire danger at any given area in New Zealand, at any given time. Fire Danger graphs can also be created from the information contained within the Fire Weather Indices.
Fire Danger graphs can also be created from the information contained within the Fire Weather Indices
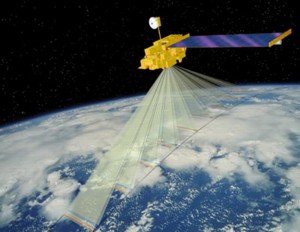
FWI - Map GuideMaps of the fire weather conditions are an extremely useful method of displaying this information. How they are created The maps are merely a representation of the raw data which represents an actual value for a specific point on the ground. At the moment assumptions are made as to what area the stations reading applies to. Using GIS technology, the system works like this: New Zealand is divided up into a number of square cells each side 2000 m long to form a grid across the land. Where a weather station falls within a cell, the cell is assigned the readings for that station. Cells around the station have similar, but not exactly the same values as the weather station. Cells in-between two weather stations will have a value somewhere between the two. For example, if two stations have temperature readings of 10 and 20 degrees respectively then a cell half-way between them would have a value of 15 degrees (assuming there is flat ground between them). When all of the FWI weather inputs have been "interpolated" in this manner, the FWI codes and indices can then be "calculated". Mathematical operations can be performed on overlapping cells to assign a value in a new cell. For example, to create the Drought Code grid, the entire Temperature, Rainfall and previous days DC grid can be used as inputs to the calculation of the DC value using the formula in the FWI System. The system used to create the maps is called the Spatial Fire Management System (sFMS) and was developed in Canada as an application of ESRI's ArcView GIS product. Limitations When basing decisions on the map information it will help if you are aware of some of the limitations that should be considered.Scale and resolutionThe maps are only a representation of the raw data. They are intended to provide a broad-brush overview of the national situation. There is not a high enough resolution to represent local conditions. Weather station Placement Traditionally, the placement of weather stations on the New Zealand network has been concentrated in areas where there are frequent fires and hot, dry climates. This means that there are areas of the country where there is very little coverage. This makes the data in that area less representative of the actual weather. Interpolation method The most appropriate method of interpolating weather data is what is called a Thin Plate Spline. This is best imagined as a thin sheet of metal placed over the country which is then distorted up and down depending on values at the weather station sites. Because there is some "rigidity" in the spline, some averaging may occur over sites. This means that the actual value recorded by the weather station may not be assigned to the weather station's cell but is averaged over the surrounding weather stations and cells. This will mean that "spikes" or extreme values may not show up as well. One should refer to the raw data if this is suspected. District and city councils across New Zealand use these parameters to construct fire plans which outline the areas of wildfire risk, for fire prevention measures, readiness policies and procedures, and response and recovery procedures. Satellite monitoringSatellite remote sensing technology is commonly being used to provide the required data for fire fuel mapping, fire danger monitoring (detection and tracking), and burn severity assessments. The term remote sensing is given to the measurement or analysis of properties of the Earth’s surface from a location not in physical contact with the objects in view. Remote sensing is nothing new to humans; we do it with our eyes all the time. When we scan the environment with our eyes we are sensing the shape, size, and colour of objects from a distance, registering energy from the visible wavelength portion of the electromagnetic spectrum (Fig. 20). Remote sensors on satellites and other craft are able to sense a broader range of wavelengths than can our eyes. They can be designed to “see” wavelengths shorter than visible light (ultraviolet) and wavelengths longer than visible light (infrared and microwave radar). Satellites are able to record data as digital images, which are broken down into pixels (picture elements). This digital data is able to be processed in many ways to enhance its utility: simulated natural colour, “false” colour to highlight a particular feature, and enhanced contrast, to name just a few.
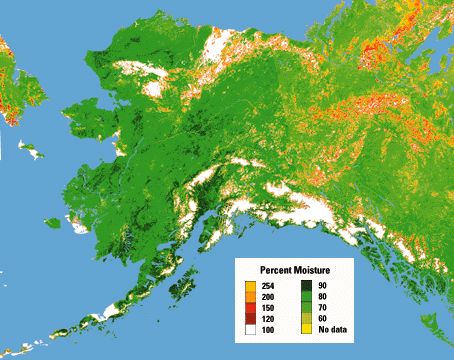
U.S.A Wildland Fire Assessment System The USDA Forest Service Remote Sensing Applications Center in association with the US Geological Survey, and NASA Goddard Space Flight Center, have been developing tools for the accurate assessment of fire potential, severity and post-fire effects in the United States. a) Greenness Mapping Since the early 1990’s, the EROS Data Center in Sioux Falls, South Dakota has been producing weekly and twice-weekly maps of the 48 contiguous States, plus Alaska, that display plant growth and vigour and vegetation cover using multispectral data from satellites of the National Oceanic and Atmospheric Administration (NOAA). Greenness maps are generated over a two week period, providing comprehensive growing season profiles for forests, grasslands, and agricultural areas, which can then be used by fire and land managers to assess the condition of all vegetation over the growing season. Greenness is literally a function of the moisture content in the vegetation concerned (Fig. 23). This information can then provide the foundation for planning for fire suppression, scheduling of prescribed burns, or studying the long-term vegetation changes resulting from natural or human-induced wildfires.
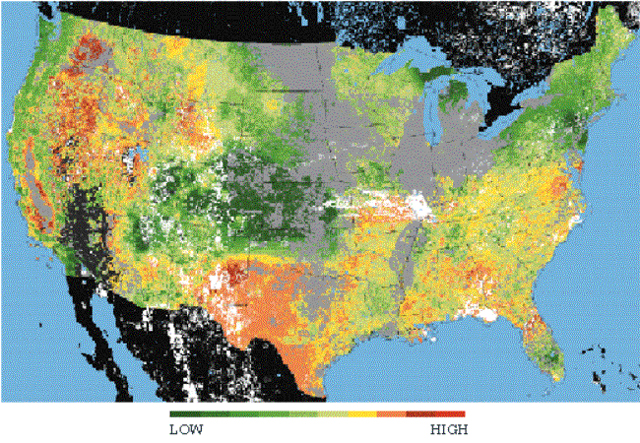
The Fire Potential Index (FPI) (Fig. 24) is another valuable fire management tool that has been developed by the USDA Fire Service and USGS scientists. It characterizes relative fire potential for forests, grasslands, and agricultural lands, both locally and regionally, so that land managers can develop plans for minimising the threat from fires (www.usgs.gov). The FPI combines multispectral satellite data from NOAA with GIS technology to generate 1-km resolution fire potential maps of any given area. Input data includes the fuel load (derived from vegetation maps), plus the water content of the dead material, and the fraction of the total fuel load that is live material. Water content of dead vegetation is calculated from temperature, relative humidity, cloud cover and precipitation, and the proportion of living plants is derived from the greenness maps described above. The FPI of any given area is updated daily to reflect the changing weather conditions and is posted on the USDA Forest Service website.
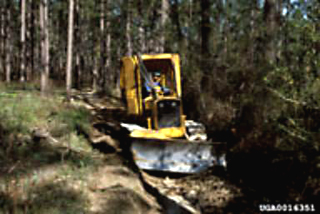
Fire fighting methodsThe main human response to an unwanted fire is to fight it and try and put it out. The work of individual firefighters benefits us all. Every year thousands of firefighters risk their lives to battle sometimes merciless blazes. Here are some of the techniques that are used to suppress and extinguish fires. Fuel removal Wildfires feed on any flammable material or fuel around the burning area, and therefore, one of the first things firefighters do is remove this material, constructing a fireline around the wildfire to control it. A fireline, which looks a lot like a trail or a small road, is a strip of land cleared of flammable materials. Ground-based crews build a fireline by clearing vegetation with tools such as bulldozers, shovels or chainsaws, working along the sides of the blaze towards the burning front.
In addition to building firelines and dousing the fire with water and fire retardant, ground crews may also use backfires (Fig. 27). Backfires are often used when fighting crown fires which may be difficult to extinguish. These are fires that are started by the ground crew that advance toward the burning wildfire. The goal of this carefully controlled burning on the leeward side of the blaze is to burn up any potential fuel in the path of the progressing wildfire.
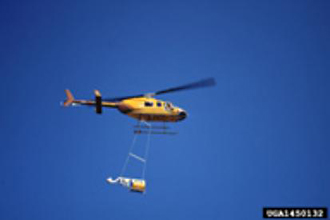
Firefighters find water to be the single most useful tool for fighting a fire. Water is delivered to a fire in hoses, backpack pumps, and helicopter buckets, and is usually sourced (by pump) from a creek, lake, or tank (Fig. 28).
Fire retardants contain a chemical salt, such as ammonium sulphate or ammonium phosphate, which alters the combustion process. These retardants rely primarily on chemical reactions between the retardant salt and the products of the combustion process. The salts permit decomposition of the fuel at a lower temperature, thereby promoting the formation of water, and carbon monoxide, at the expense of flammable gases (fuel will burn by charring alone, not by flaming). Other ingredients of the retardant formulation (e.g. water, clay such as bentonite, and guar gum) provide a cooling action to the fire and fuels. A fire retardant will perform the needed fire control job in all types of vegetation and weather conditions, since the fire-inhibiting salt clings to the vegetation and remains effective even after water has evaporated. Naturally, the drawback in using these chemical retardants over foam or water are that incorrect use can have adverse effects on ecosystems.
Wildfire Mitigation: Prevention and Protective Measures – ReadingsRead the following three reprints on assessing the wildfire hazard, and on bushfire prepared communities. (1) National Wildland/Urban Interface Fire Protection Program: Wildland/Urban Interface Fire Hazard Assessment Methodology. (2) Northern Territory Government: Bushfire Prepared Communities. (3) Wildland fires in New Zealand in the 1990s: retrospective and challenges.
|
||||||||||||||||||||||||||
| [BACK] | [NEXT >> Exercise] |
| |
|
Introduction The Basic Elements of Fire Fire Behaviour Impacts of Wildfires Wildfire Mitigation: Prevention and Protective Measures Assignment References |