|
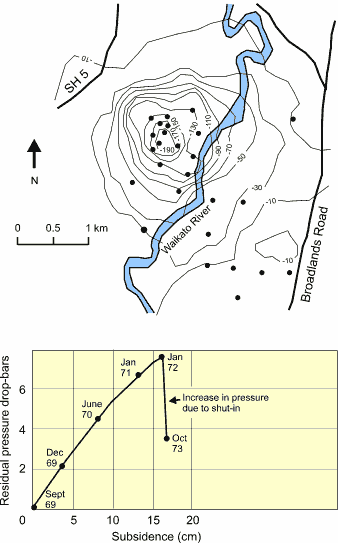
Figure 12. Subsidence at Broadlands geothermal field. Subsidence contour values are in millimetres. Black dots show location of extraction wells. Lower graph shows relationship between pressure fall in the field and subsidence, and clearly shows ground recovery associated with the 1971-1974 shutin (after Narasimhan and Goyal 1984). |
