
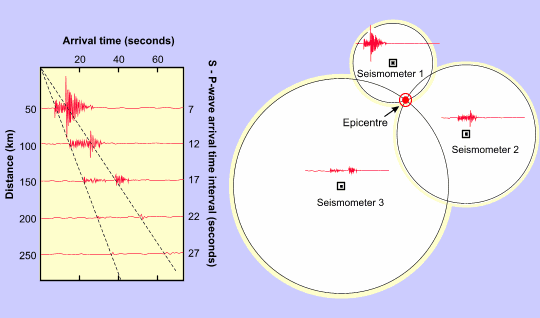
Figure 5. The graph on the left hand side of this figure
shows three earthquake traces superimposed on a plot of P and S-wave
arrival times. The right hand sketch shows these traces superimposed
on circles with radii corresponding to the time interval between
P and S-wave arrivals.
|